Our Services
Unleash the Potential of Your Data
Utilize the Power of Real-Time Data Visualization
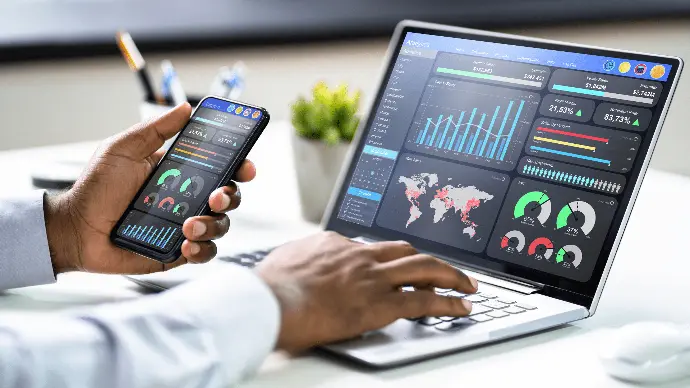
In today's rapidly evolving and data-centric world, the ability to comprehend information, seize opportunities, and effectively address challenges in real-time is crucial. Real-time data visualization simplifies complex datasets by transforming them into visual stories, enabling employees and management to monitor, manage, respond, and make well-informed decisions.
Experience the true power of your data with our suite of data visualization services. Our seamless integration process connects your data from spreadsheets, databases, APIs, or cloud services, and effortlessly transforms it into dynamic dashboards. Immerse yourself in a world of visual elements that bring your data to life.

Monitor the Now
Manage Performance
Seize the Moment
Identify Trends
Respond Instantly
Track KPIs
Adapt in Real Time
Detect Anomalies

Interactive Real-Time Dashboards
Experience the real-time power of data at your fingertips..
Our interactive dashboards provide instant updates on your essential metrics, enabling you to adapt quickly to changing situations. Whether it's analyzing sales performance, understanding customer behavior, or tracking project milestones, we ensure you have a clear and comprehensive overview.

Real-Time Graphs and Charts
Spot insights at a glance..
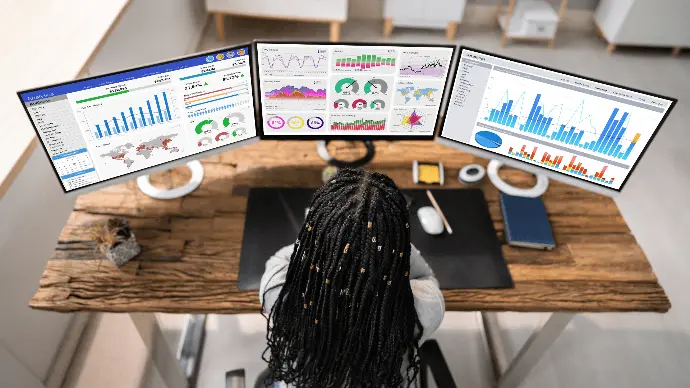
Numbers in motion tell a compelling narrative, but graphs and charts animate it. Our expertise lies in crafting dynamic visualizations of your data that capture real-time trends and fluctuations, empowering you to understand data as it happens, and gain a competitive edge.

Instantly Updated Insightful Tables
It’s not about numbers, it’s about context..
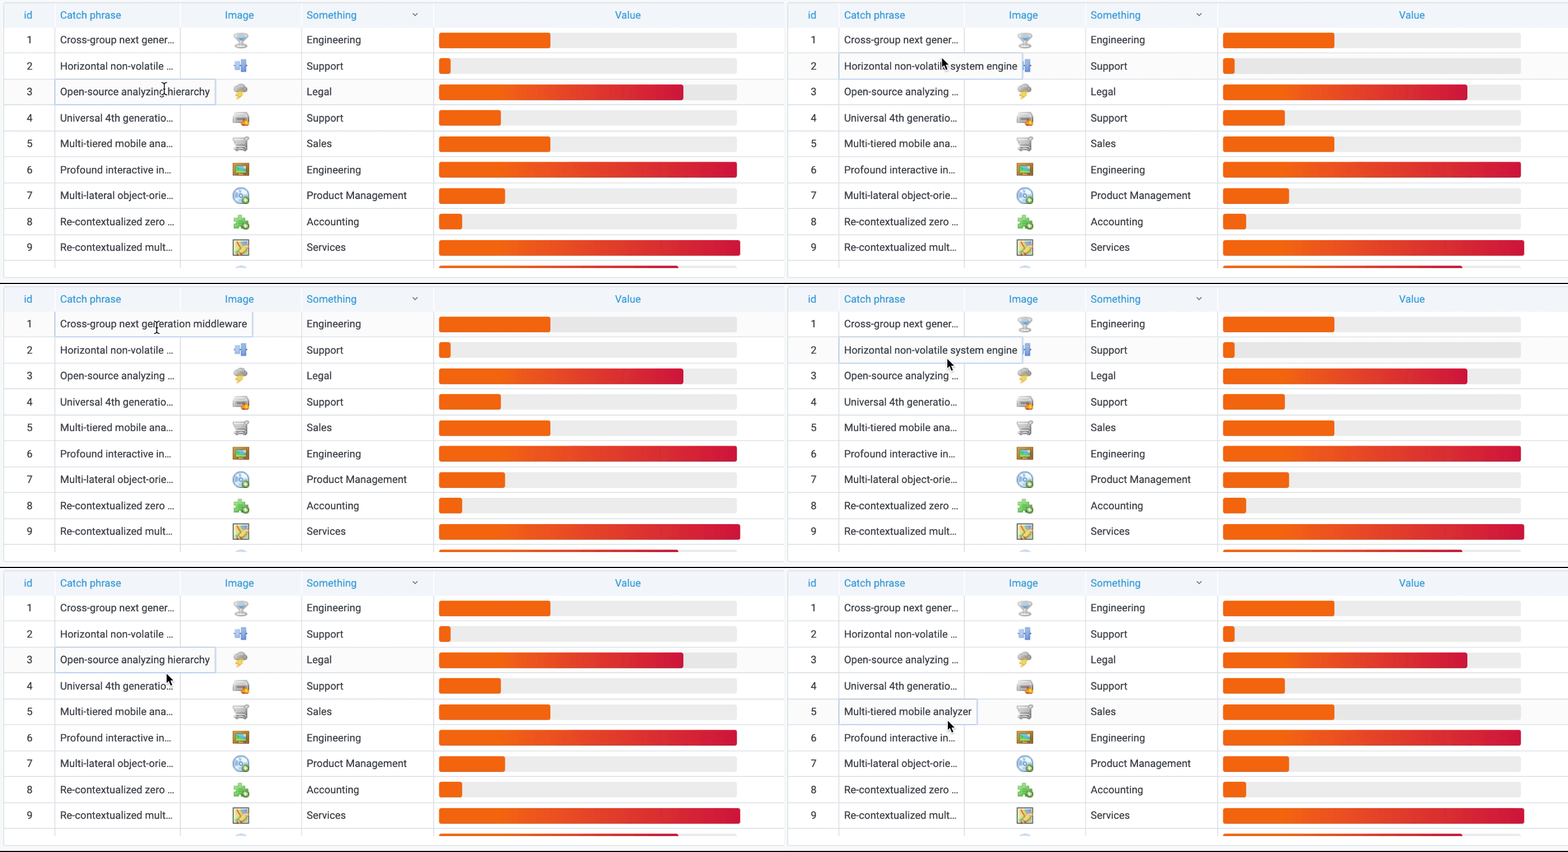
In a world where seconds matter, our tables organize data in an easy-to-understand and compare format, allowing you to compare, analyze, and draw insights efficiently. They are constantly refreshed with real-time data, enabling you to track information as it changes and make swift decisions.

Live Dynamic Gauges and Metrics
Visualize your progress..
Track key performance indicators (KPIs) change in real time with our live dynamic gauges for instant monitoring. See performance metrics move as conditions shift. Instantly recognize if you're on target or need to take action.

Fluid Informative Logs and Timelines
Adapt and respond in the moment..
In real-time scenarios, logs and timelines become indispensable. They offer a live window into a chronological view of events. They're particularly valuable for understanding historical patterns, identifying anomalies, and making informed predictions.